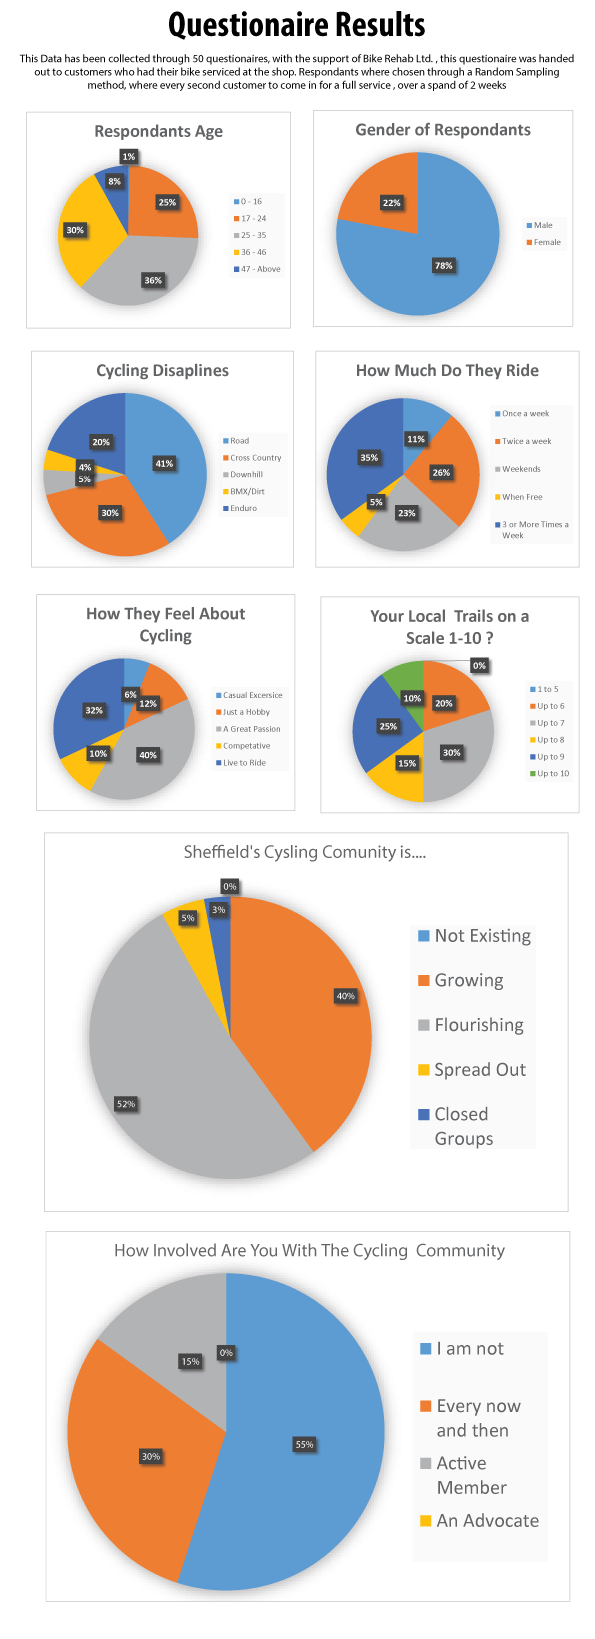
I have hit the target for my questionnaire, finally received all the data needed to carry on with analysis and the development of the pen pictures. I have compiled the information into pie chart graphs each highlighting the percentage of answers given by the respondents.

